When it Comes to Data, Demand Quality and Personalization

With both established and new companies offering many types of data sources, it can be difficult to decipher truth from hype. Not sure if you’re getting the most value out of your data? Here are four checks your data should meet.
One thing to look for in performance data is how many times a particular product has been tested in the field. This is often denoted by least significant difference (LSD), a metric indicating that enough side-by-side replications have been performed on the product to reduce field variability.
For example, a low LSD means trial error has been minimized through many replications and is a good indication that there’s been more testing and less variability between results. We’re able to provide low LSDs through the Answer Plot program due to the level of local, regional and national testing conducted. This means we can account for conditions similar to your fields while ensuring validity through regional and national data. It also means we learn from bad results and, at our own expense, limits the need to test on your own land.
Be wary of crowd-based data systems. They’re susceptible to inaccuracy because they rely on individual, manual upload. Ask farmers if they’d trust their neighbors’ data or if they upload data from their combine accurately every time and most will say no. The quality of data and insights is only as good as the data input.
Data from a combine doesn’t tell the whole story. It doesn’t tell you what the weather was in a particular month, and it doesn’t offer insights on the agronomic practices used in the field. Yet, this type of information — as well as geography, maturity zones, soil textures, irrigation and what’s occurred in previous years — should figure prominently into your decision-making process.
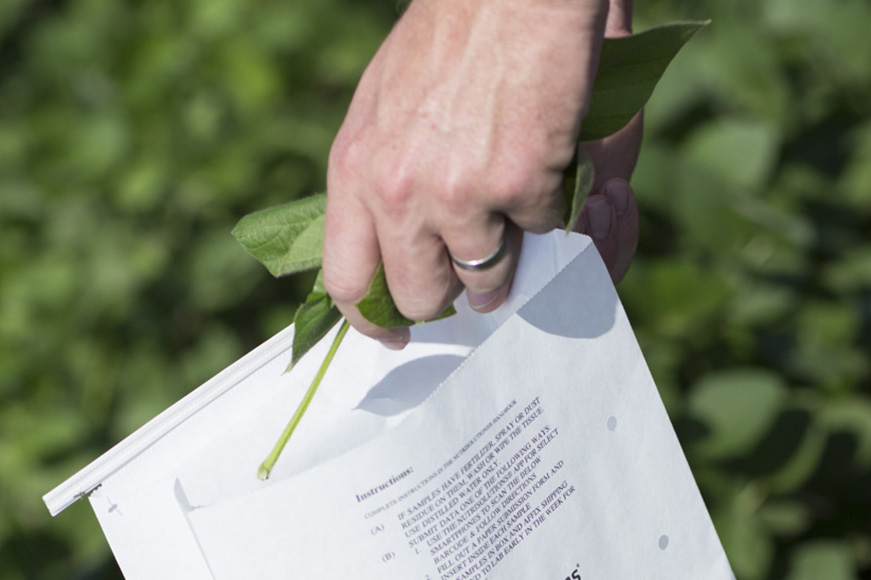
From the combine and in-season imagery to trials, tissue sampling and more, data comes from many sources. A local trusted advisor can and should help ensure all these data sources are connected. They can analyze and interpret all of the different data sets to help make personalized and quality recommendations for your operation.
Contact your local WinField United retailer to learn more about getting the most value out of your data.
All photos are either the property of WinField United or used with permission.
© 2021 WinField United. Important: Before use always read and follow label instructions. Crop performance is dependent on several factors many of which are beyond the control of WinField United, including without limitation, soil type, pest pressures, agronomic practices and weather conditions. Growers are encouraged to consider data from multiple locations, over multiple years, and to be mindful of how such agronomic conditions could impact results. Answer Plot, and WinField are trademarks of WinField United.
Valid.
If data is not valid or backed by strong replication and analytics, it doesn’t provide you much confidence in the decision-making process. Field trials, like those conducted at WinField United Answer Plot® locations, test products multiple times. Answer Plot trials even test products that directly compete with WinField United to provide an unbiased comparison of what works in certain conditions, what doesn’t and why. Whatever data source you choose, make sure it has integrity.One thing to look for in performance data is how many times a particular product has been tested in the field. This is often denoted by least significant difference (LSD), a metric indicating that enough side-by-side replications have been performed on the product to reduce field variability.
For example, a low LSD means trial error has been minimized through many replications and is a good indication that there’s been more testing and less variability between results. We’re able to provide low LSDs through the Answer Plot program due to the level of local, regional and national testing conducted. This means we can account for conditions similar to your fields while ensuring validity through regional and national data. It also means we learn from bad results and, at our own expense, limits the need to test on your own land.
Be wary of crowd-based data systems. They’re susceptible to inaccuracy because they rely on individual, manual upload. Ask farmers if they’d trust their neighbors’ data or if they upload data from their combine accurately every time and most will say no. The quality of data and insights is only as good as the data input.
Prescriptive.
Analytics should do more than simply compare findings against historical data or performance from other farmers. Many crowd-sourced data companies offer descriptive analytics, which tell us about something that’s happened in the past. Descriptive analytics can be helpful for looking at field attributes like soil sample components but pairing a hybrid by soil type is not something you likely want to do with data from the past. For these decisions, it’s best to look at prescriptive analytics, which use data to prescribe an action.Specific to your fields.
Not your neighbor’s fields. Not other fields in your region. Your fields.Data from a combine doesn’t tell the whole story. It doesn’t tell you what the weather was in a particular month, and it doesn’t offer insights on the agronomic practices used in the field. Yet, this type of information — as well as geography, maturity zones, soil textures, irrigation and what’s occurred in previous years — should figure prominently into your decision-making process.
Comes with an advisor.
Think of your doctor. They would never just hand you an X-ray and expect you to read it and diagnose the issue yourself. That’s where the radiologist comes in. While there are many instances when farmers are confident analyzing data and making a product selection themselves, there should always be an option to contact a reliable advisor to help determine a diagnosis and plan of action. Some options claim to offer cost savings by essentially circumventing the retailer and advisor. What’s lacking is the expertise and troubleshooting help when data gets complex or unusual issues pop up in the field.From the combine and in-season imagery to trials, tissue sampling and more, data comes from many sources. A local trusted advisor can and should help ensure all these data sources are connected. They can analyze and interpret all of the different data sets to help make personalized and quality recommendations for your operation.
Contact your local WinField United retailer to learn more about getting the most value out of your data.
All photos are either the property of WinField United or used with permission.
© 2021 WinField United. Important: Before use always read and follow label instructions. Crop performance is dependent on several factors many of which are beyond the control of WinField United, including without limitation, soil type, pest pressures, agronomic practices and weather conditions. Growers are encouraged to consider data from multiple locations, over multiple years, and to be mindful of how such agronomic conditions could impact results. Answer Plot, and WinField are trademarks of WinField United.


