Range and Pasture Update: How Cattle Producers Can Harness Tech
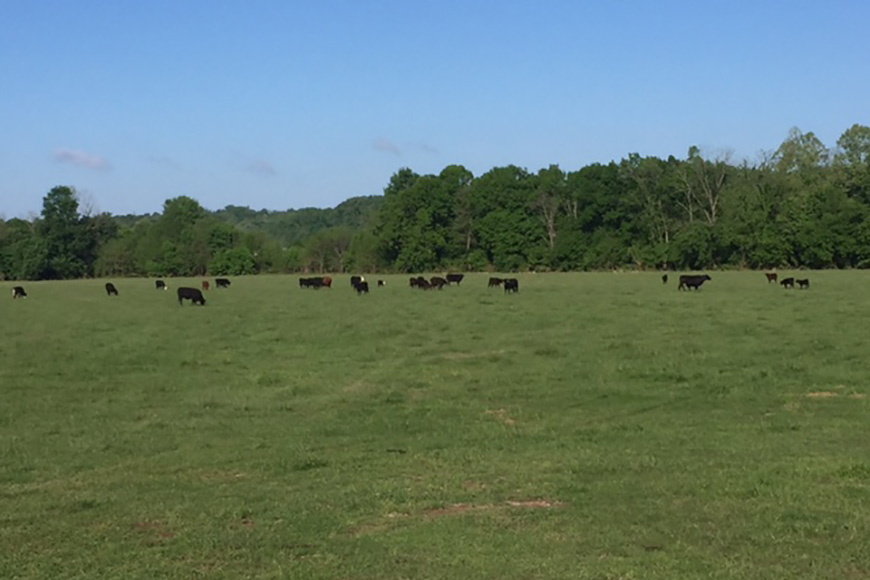
Using crop health data such as biomass levels to plan in-season input applications is a common practice among row-crop farmers. Now, cattle producers are using the same technology to determine comparative trends in biomass levels for the range and pasture market. By observing these trends, they can optimize stocking rates and make better fertility and weed management decisions.
Biomass levels can be gauged with the R7® Field Monitoring Tool from WinField United. The benchmarking feature of the tool can identify which pastures may be trending down in health and allow the producer to make more timely adjustments.
Appropriate stocking rates
A stocking rate refers to the number of animals that can be grazed on a given amount of land over a certain period of time. An optimum rate would be one that maintains the overall health of the pasture and doesn’t require any additional forage supplement. In theory, the greater the amount of biomass in a pasture, the greater the number of cattle that can be put on that pasture.
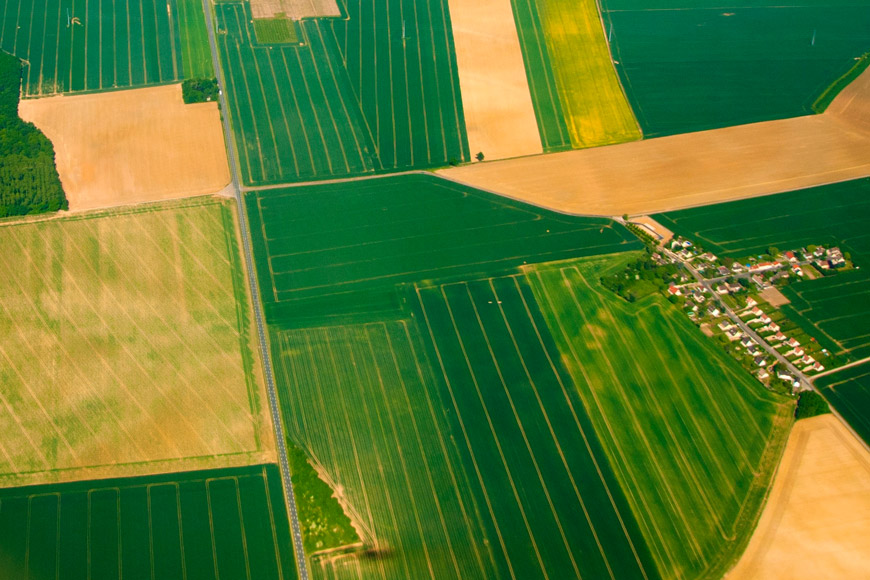
This season, we’re piloting the Field Monitoring Tool with about a dozen cattle producers: in my state of Arkansas as well as in Texas, Oklahoma, Kansas and Missouri. We’re using the tool to monitor cultural and management practices, as well as fertility and herbicide applications. Then, through satellite imagery, we’ll measure biomass and the normalized difference vegetation index (NDVI) to help producers optimize stocking rates and ROI potential.
Gaining insights
Our goal is to generate insights based on what the Field Monitoring Tool is telling us about whether field biomass is trending up or down compared to other fields, and how the fields responded to different management, different products, or no products. We are primarily monitoring the pasture grasses bermudagrass and fescue, but also we plan to use this in wheat pasture operations as well.
We will be working with local retailers to check in with producers during the season to show them what we are seeing and learning about the pastures they have enrolled in our pilot program. Using the Field Monitoring Tool history function, we can let them know throughout the season what has transpired since the date the tool began monitoring their grasses. At the end of the season, we’ll share results with program participants, as well as at local rancher and grower meetings.
Ultimately, we want to share metrics to help define the opportunity for additional producers to use the Field Monitoring Tool for monitoring biomass. For hay producers, for example, success would be measured in more tons per acre. In beef production, higher-yielding and healthier pastures will generally translate into those cattle converting more grass into beef, resulting in higher returns when producers market their cattle.
We’re excited about the new opportunities the Field Monitoring Tool can bring to the range and pasture segment.


