Dial In to Data Quality

Winter is here and it’s time to formulate a farm plan for next season. Take time to review data from 2018 and use it to make decisions for 2019. Here are some ways to help ensure your data is as accurate and information-rich as it can be.
1. Demand data that’s replicated.
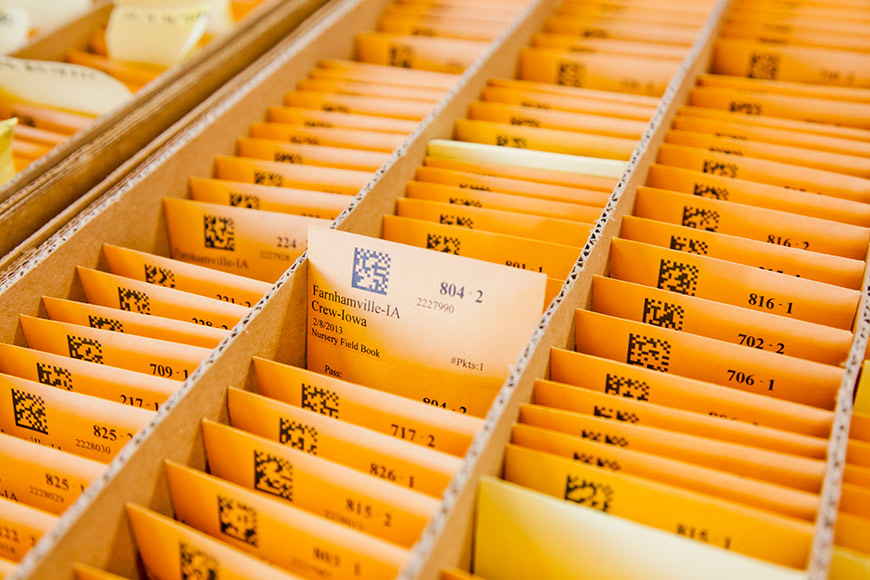
Agronomic data that’s backed by extensive replicated trials helps verify whether variations in that data are due to error or to the effects of different treatments. Data that undergoes a quality assurance process gives you the confidence to use it to make critical decisions. WinField United Answer Plot® data is derived from high-quality, replicated research with built-in controls that help us understand product performance so we can offer recommendations you can trust.
2. Know the limits of crowdsourced data.
Crowdsourced data can tell you what happened when a product was tested, but not why it happened or how it happened. Knowing the kind of environment in which a product performed well, and how it interacted with other products, are steps toward better predictability. Crowdsourced data doesn’t offer that level of specificity.
3. Request data that’s prescriptive.
Farmers need information that helps them make decisions about future crops. Conclusions made about commercial products that have been in the market for a while can be useful if you continue to use those products. However, those same conclusions have limited value when you’re considering new products you haven’t yet used on your farm. WinField United delivers insights on many seed and crop protection products at least a year ahead of data that is crowdsourced.
4. Insist on data that represents your fields.
Notice I didn’t say, data that “is specific to” your fields. Using on-farm data or research from nearby fields used to be the standard. Now, using environmental characterization, we can identify research from locations nationwide that can represent the average environment of a given farm.
Said another way, when you only use local data, you make inferences based on past performance to represent next year. But next year is probably going to be a lot different from this year. By using data from a field in another location during the same year, we can represent the average of your farm’s environment and use that information to make decisions.
5. Work with your local trusted advisor.
Meet with your advisor now to navigate Answer Plot data and start making plans for next season. Every year is different, and your advisor can recommend the tools and insights needed to help you navigate your data and use it to start 2019 off right.
© 2018 WinField United. Answer Plot® and WinField® are trademarks of WinField United.


