Calibrate Your Nutrient Management

Have you ever received results of an early-season tissue test that indicated your corn was low on nitrogen? If so, did you wonder if it was because you didn’t apply enough or because the plant roots weren’t big enough to take up the nitrogen that you applied?
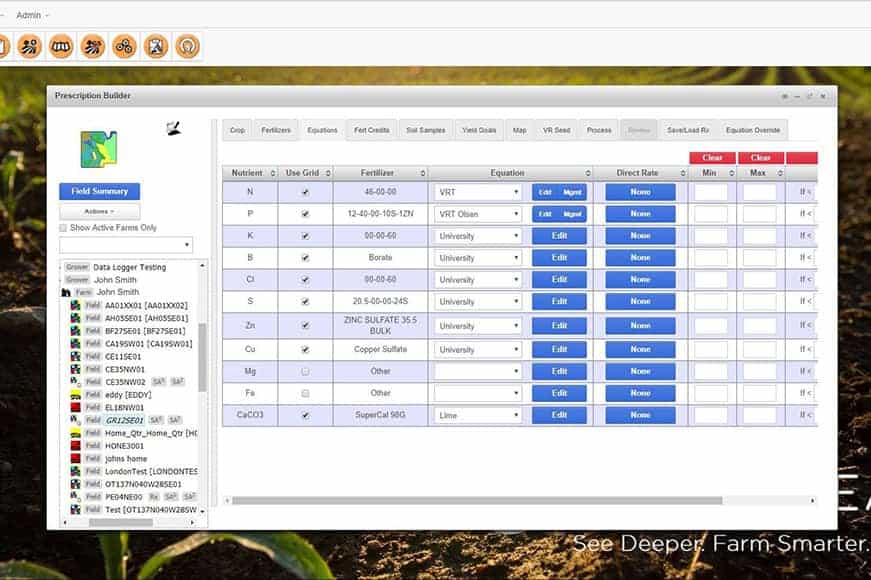
The R7® Field Forecasting Tool by WinField United connects tissue testing with crop modeling to help farmers better understand macronutrient dynamics — specifically nitrogen and potassium — throughout the season to help them make better decisions for the current season and for the future.
Calibrating the model
At WinField United, we leverage data from our Answer Plot® program as well as in-season weather and application details to calibrate the model. This allows us to keep both in-season and historical data fresh.
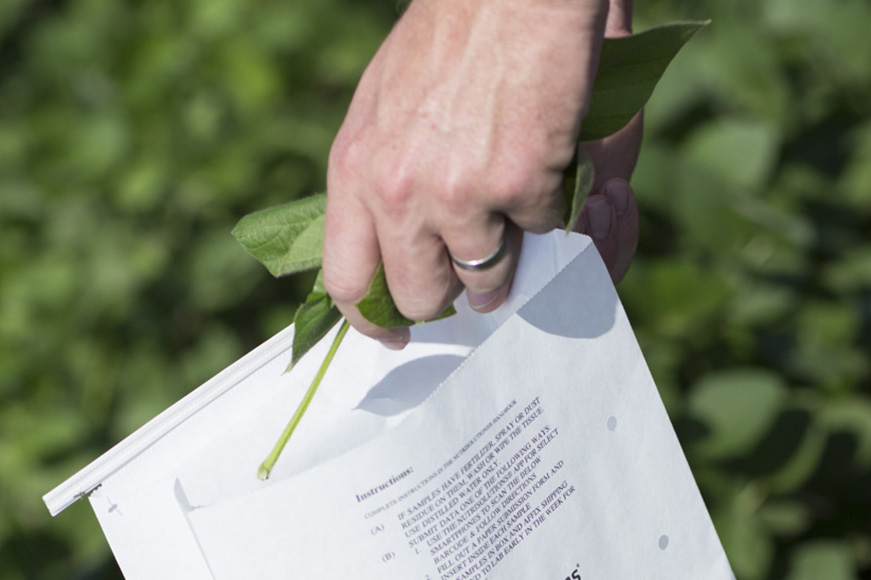
In addition, we can calibrate the Field Forecasting Tool in-season with tissue tests. Most crop models today account for things like plant growth; soil processes; and nitrogen, potassium and water dynamics in the plant. However, there are other things that aren’t necessarily modeled that can have an effect on yield potential, including diseases, insects, tillage practices and compaction issues. If we take a good tissue sample and calibrate it to the actual levels of macronutrients the plant contains, we’re using the plant as the sensor. This allows us to eliminate much of the error that is created by those external factors that can limit yield but that aren’t modeled.
What you can do
With the Field Forecasting Tool, you can look at last year’s data and manipulate the decisions you made to see how they would have changed your final yield. This allows you to do a better job of planning, letting you determine, for example, if making an adjustment to your nitrogen program would have a financial benefit this year.
The tool can also help you fine-tune your in-season nitrogen application rates because the model is forward-looking. It not only includes historical information; it looks ahead based on weather predictions for the current year and gives you an estimate of yield at the end of the season. For example, you and your agronomist can run scenarios and manipulate rates to see, based on the model’s output today, if adding 20 units of nitrogen would be profitable.
What’s happening so far this year?
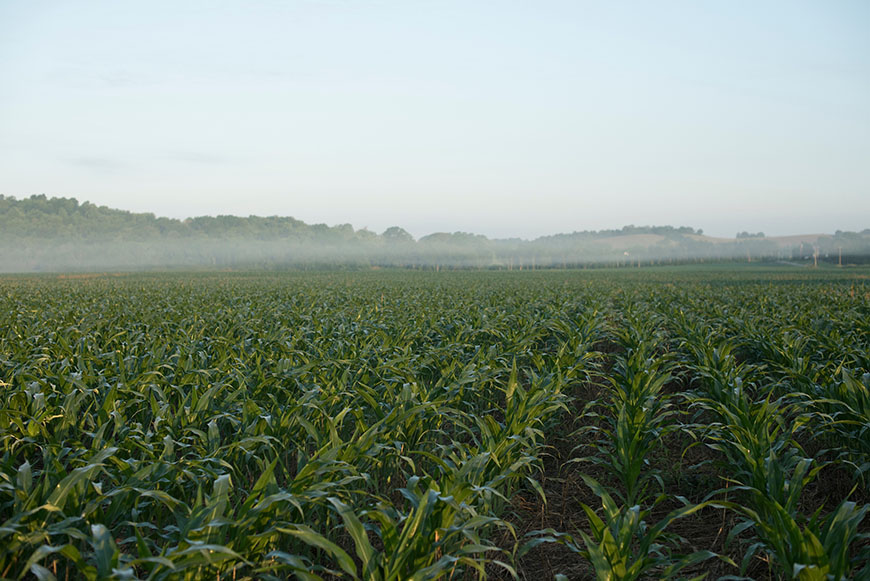
In many regions of the country, after crops were planted temperatures turned very warm very fast, which spurred crop growth. The Field Forecasting Tool predicted that V5 in corn was going to occur, generally speaking, a week to 10 days later than it was actually occurring in the field. So a farmer could go into the tool and tell it V5 isn’t happening a week from now; it’s happening today. Having the ability to correct scenarios allows you to get a more accurate prediction of crop growth as the season progresses.
Although plants are growing faster than predicted, there is some water stress predicted in certain parts of the country for July, which could hamper yield potential. All the more reason to work with your trusted advisor to correct the model, keeping it accurate and on track so that it becomes a better predictor of what harvest might bring.


